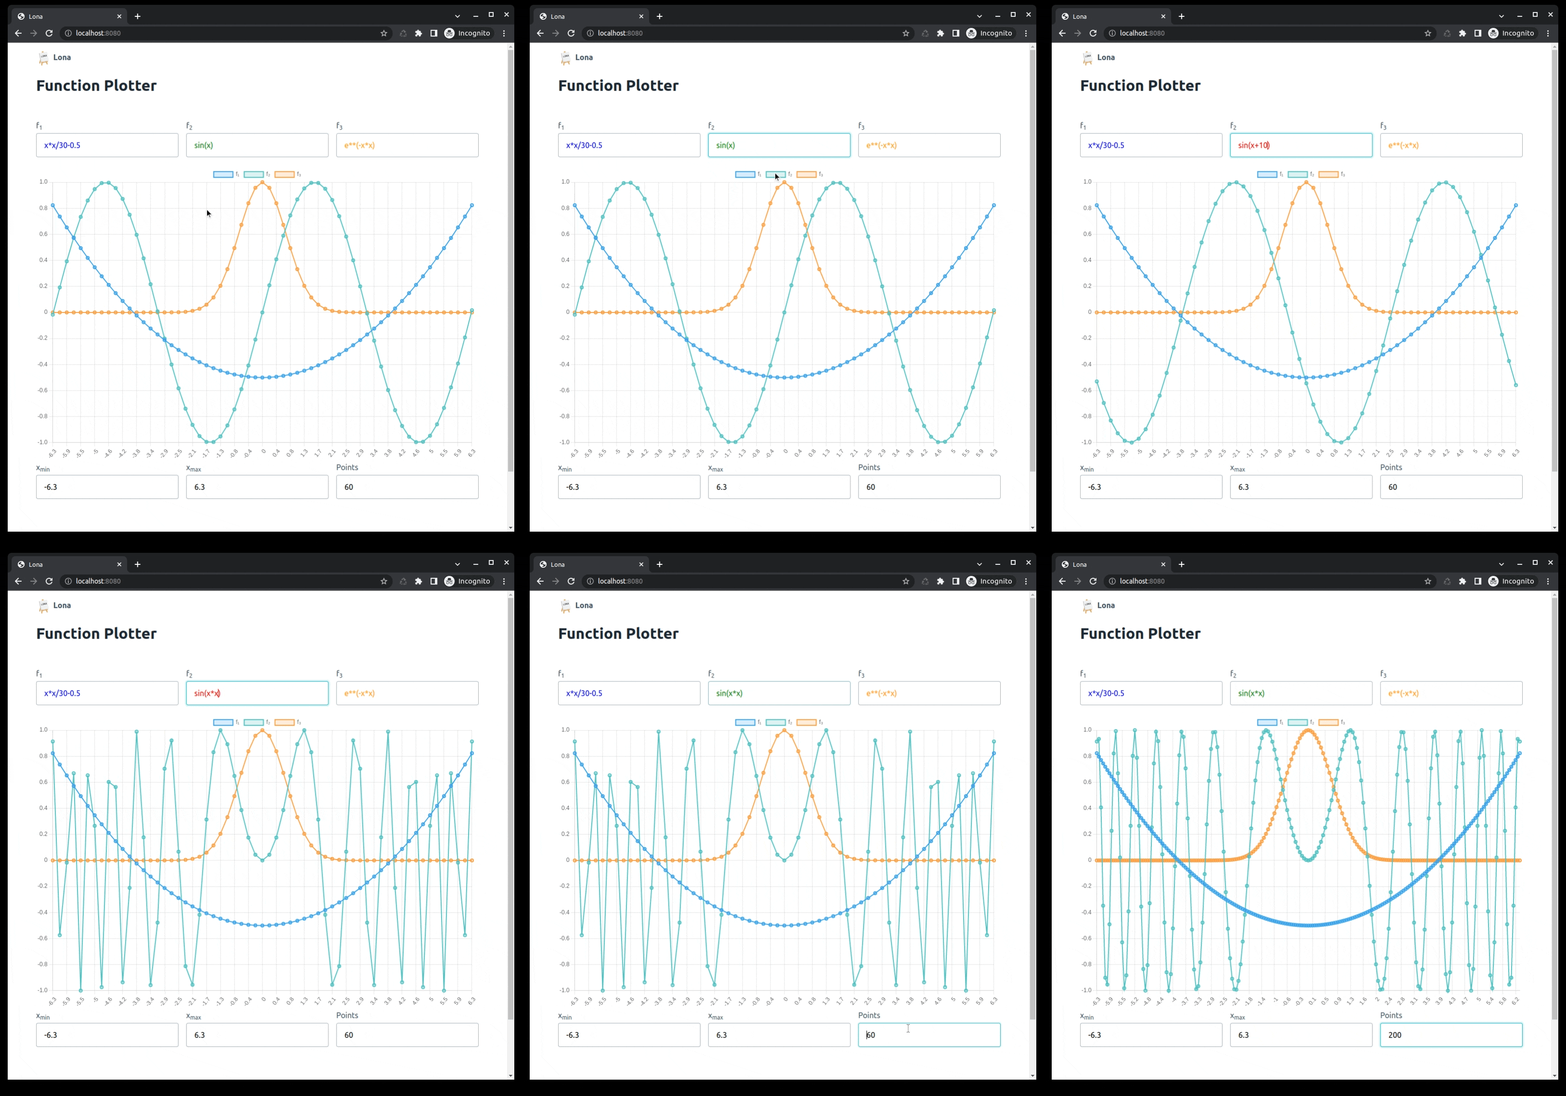
Function Plotter
Author: @markusgritsch
Source Code
import math

from lona_picocss.html import (
    NumberInput,
    TextInput,
    Label,
    HTML,
    Grid,
    Sub,
    H1,
)
from lona_picocss import install_picocss

from lona import View, App

from lona_chartjs.html import Chart

app = App(__file__)

install_picocss(app)

app.settings.PICOCSS_THEME = 'light'

colors = {
    'red': 'rgba(255, 99, 132, 1)',
    'blue': 'rgba(54, 162, 235, 1)',
    'yellow': 'rgba(255, 206, 86, 1)',
    'green': 'rgba(75, 192, 192, 1)',
    'purple': 'rgba(153, 102, 255, 1)',
    'orange': 'rgba(255, 159, 64, 1)',
    'grey': 'rgba(201, 203, 207, 1)',
}


def alpha(color, alpha):
    return colors[color].replace('1)', str(alpha) + ')')


CHART_DATA = {
    'type': 'line',
    'data': {
        'labels': [],
        'datasets': []
    },
    'options': {
        'animation': False,
        'responsive': True,
        'scales': {
            'y': {
                'beginAtZero': True,
            }
        }
    }
}


@app.route('/')
class Plotter(View):
    def handle_request(self, request):
        self.chart = Chart(
            width='600px',
            height='400px',
            data=CHART_DATA,
        )

        self.f_list = []
        for f in ['x*x/30-0.5', 'sin(x)', 'e**(-x*x)', 'sin(x)/x']:
            self.f_list.append(
                TextInput(
                    f,
                    handle_change=self.handle_text_input_change,
                )
            )

        self.x_min = -6.3
        self.x_max = 6.3
        self.point_count = 60

        self.xmin = TextInput(
            self.x_min,
            handle_change=self.handle_text_input_change,
        )

        self.xmax = TextInput(
            self.x_max,
            handle_change=self.handle_text_input_change,
        )

        self.points = NumberInput(
            self.point_count,
            handle_change=self.handle_text_input_change,
        )

        html = HTML(
            H1('Function Plotter'),
            Grid(
                *[Label('f', Sub(i + 1), f) for i, f in enumerate(self.f_list)],
            ),

            self.chart,

            Grid(
                Label(
                    'x', Sub('min'),
                    self.xmin,
                ),
                Label(
                    'x', Sub('max'),
                    self.xmax,
                ),
                Label(
                    'Points',
                    self.points,
                ),
            ),
        )

        self.handle_text_input_change(type('', (), {'data': self.f_list[0].value}))

        self.show(html)

    def handle_text_input_change(self, input_event):
        try:
            self.x_min = float(self.xmin.value)
            self.xmin.style = {'color': 'black'}
        except:
            self.xmin.style = {'color': 'red'}
        try:
            self.x_max = float(self.xmax.value)
            self.xmax.style = {'color': 'black'}
        except:
            self.xmax.style = {'color': 'red'}
        try:
            if float(self.points.value) <= 0:
                raise RuntimeError
            self.point_count = float(self.points.value)
            self.points.style = {'color': 'black'}
        except:
            self.points.style = {'color': 'red'}
        step = (self.x_max - self.x_min) / self.point_count
        color_list = ['blue', 'green', 'orange', 'yellow', 'purple', 'grey']
        CHART_DATA['data']['datasets'].clear()
        for i in range(len(self.f_list)):
            x_list = []
            y_list = []
            exception_count = 0
            x = self.x_min
            while x < self.x_max + step / 2:
                x_list.append(round(x, 1))
                y = 0
                try:
                    y = float(eval(self.f_list[i].value, math.__dict__, {'x': x}))
                except:
                    exception_count += 1
                y_list.append(y)
                x += step
            if exception_count < len(x_list):
                CHART_DATA['data']['labels'] = x_list
                CHART_DATA['data']['datasets'].append(
                    {
                        'label': 'f' + chr(ord('₁') + i),
                        'data': y_list,
                        'borderWidth': 2,
                        'borderColor': colors[color_list[i]],
                        'backgroundColor': alpha(color_list[i], 0.2),
                    }
                )
                self.f_list[i].style = {'color': colors[color_list[i]]}
            else:
                self.f_list[i].style = {'color': 'red'}
            self.chart.data = CHART_DATA


if __name__ == '__main__':
    app.run()
